
Nifty Weekly View ( week ended 23 Feb 2018) – Daily Chart view

Nifty weekly view ( for Week ended 23 Feb 2018)
February 25, 2018
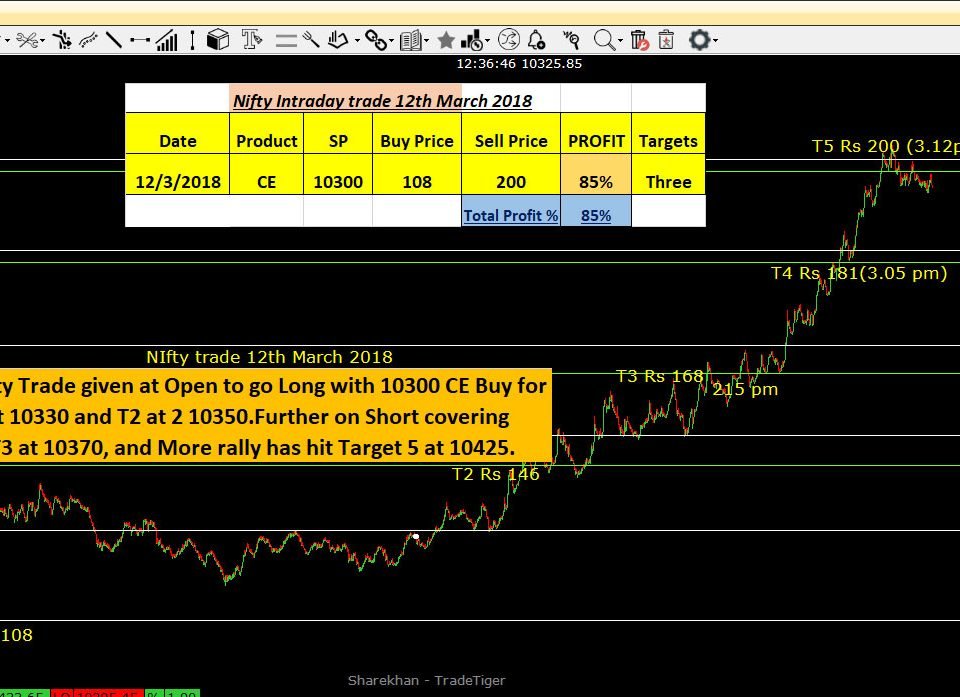
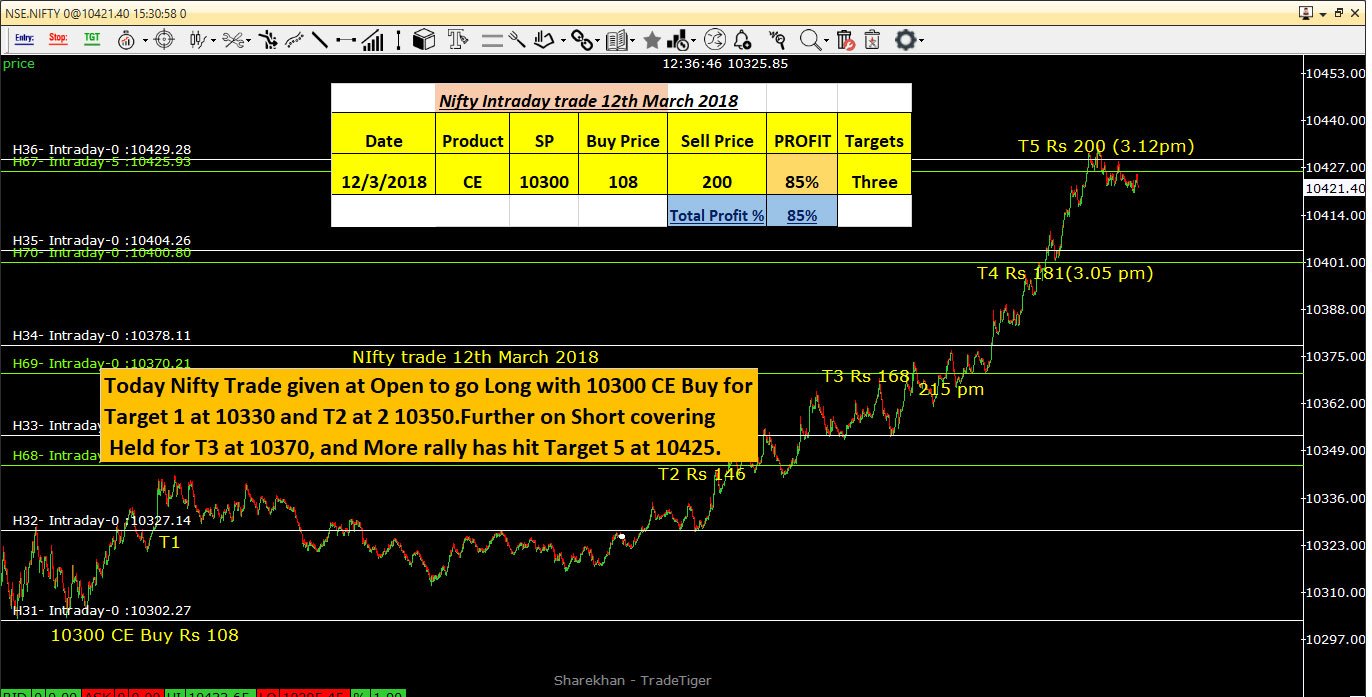
Nifty trade 12th March 2018- 85% Profit in 10300 CE( Live)
March 12, 2018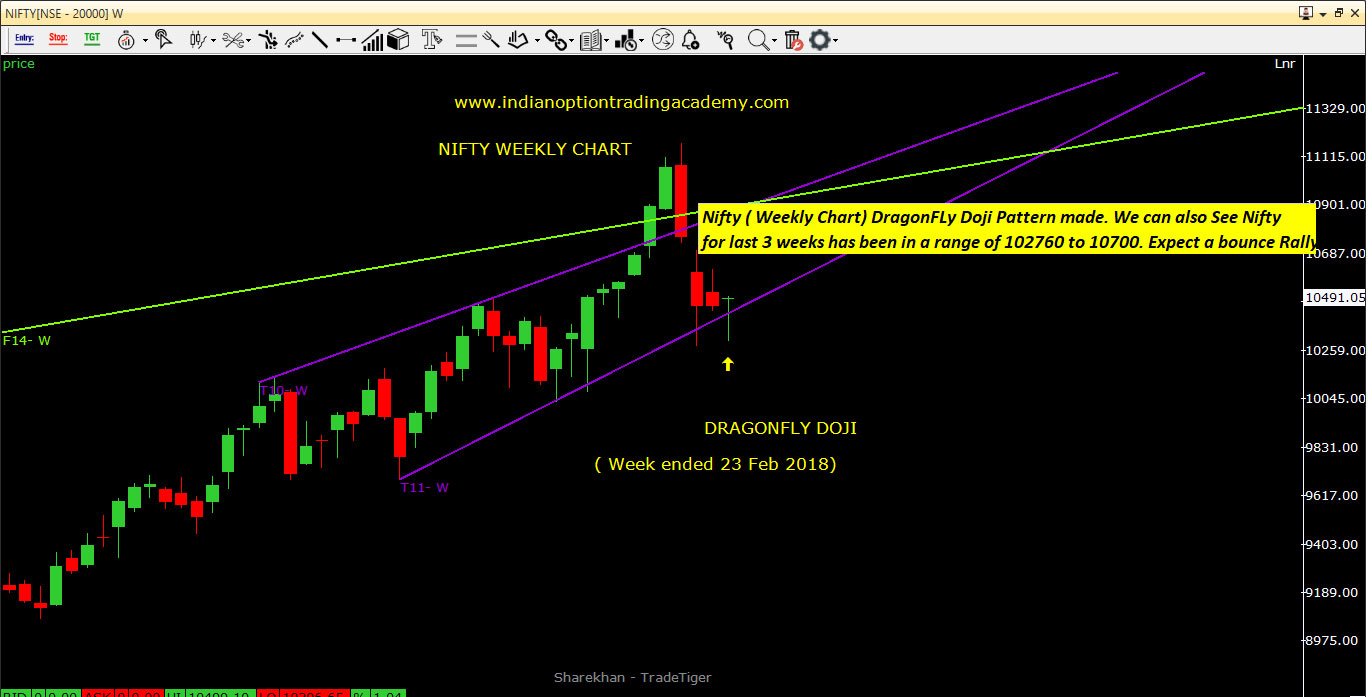
Hi Friends
Glad to Share my Nifty Weekly Views and Analysis for week ended 23rd Feb 2018 on the EOD Chart
Price has taken Support at 102760 Zones, like as double bottom, and looks ready for a Nice Up move. And Price also took Support at 50 DMA…Now Price amy make a move towards 20 DMA and if holds above 20 DMA>> expect more Rally and Short Covering
The 1st target we will look at 10600 zones>> also channel TLine and was the previous Support turned resistance zones>>> further if 10630 is broken and Price holds up>> expect next target to 10720 zones (GAP FILL).
The Fibonacci Targets we can arrive is 10618 / 10723 / 10830 and max 10950.
So next 2 weeks Price action will determine how our targets get hit.
Pl refer our Nifty weekly and EOD charts for more details.
IOTA is also glad to announce the March batch (Online webinar – 24th March). 2 Modules will be covered. Basic Technical Analysis and Advance Technical Analysis Workshop for Options Trading in Nifty and BankNifty.
Special Offer for 1st 15 Students Only. Contact us for more info.
Happy and Safe Trading